Sometimes an app just comes from nowhere to take the world by storm. It’s a particular phenomenon when it comes to games – Angry Birds springs to mind – and with the dozens of messaging apps that have been adopted in turn by the world’s teens.
In some cases, particularly in the case of games, these viral apps are very simple, and are developed quickly and almost by accident. The 2013 mobile game Flappy Bird, for example, was created in three days flat by Vietnamese developer Dong Nguyen, but within a year became the most downloaded free game in the iOS App Store.
But while this may be an inspiring story for amateur developers, it’s not how things generally work in the real world. Most apps, unfortunately, sink without trace and few make any real money.
Apps for brand recognition
“There are so many applications that are free and that will never directly generate revenue,” says Ken Dulaney, Gartner vice president and distinguished analyst. “Gartner is forecasting that, by 2017, 94.5 per cent of downloads will be for free apps.
“Furthermore, of paid applications, about 90 per cent are downloaded less than 500 times per day and make less than $1,250 a day. This is only going to get worse in the future when there will be even greater competition, especially in successful markets.”
However, for many organisations, making a direct profit isn’t really the point.
 “Our analysis shows most mobile applications are not generating profits and that many mobile apps are not designed to generate revenue, but rather are used to build brand recognition and product awareness or are just for fun,” says Mr Dulaney.
Measuring the success of an app, therefore, is no longer just a question of counting the number of downloads or even using basic metrics such as average revenue per user. It means evaluating the far more intangible quality of user engagement to try and discover what wins users’ hearts, and what doesn’t.
Such analysis, of course, needs to be handled very differently from standard software testing. While aspects of an app such as security, speed and design can most efficiently be evaluated in a lab environment, this is of limited value when testing user experience.
Creating a flawless digital experience
It’s easy enough to identify glaring problems – a slow-to-load interface or over-busy screen, perhaps. However, it’s harder to establish which of these issues, if any, are likely to make people abandon the app mid-session or put them off using it altogether; and many issues can easily slip through the net.
“Companies can no longer view their digital quality in a vacuum. They must approach it from a user-centric perspective, and test their sites and apps in the wild to ensure they work as intended in the hands of users,” says Matt Johnston, chief marketing and strategy officer at Applause, which maintains a community of more than 200,000 software testers.
“Providing a seamless, flawless digital experience for customers, be it on mobile, via web or in-store, is what strong companies are focused on. And that integrated customer experience cannot be tested, measured or optimised from a lab.”
US real estate agency Trulia says Applause testing has helped it halve the development time for new features of its app, and that the improved functionality, usability and quality of its mobile applications have brought in 10 to 15 per cent more customers. It’s also cut the cost of testing compared with in-house, with IDC estimating a saving of almost $400,000 (£280,000) a year over five years.
“The testers’ feedback has certainly helped us to develop better applications,” says Jane Lisinker-Korobov, director of quality, escalations and IT desktop support at Trulia. “We’ve also had good feedback from real estate professionals and architects in the Applause community, which has been most helpful.”
Assessing engagement metrics
There is a wide array of metrics that can be used to evaluate how much users enjoy using an app, how easy they find it to navigate and how likely they are to carry on.
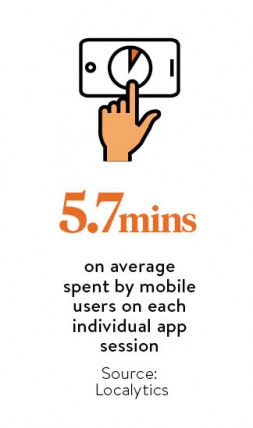
“We find that some of the best engagement metrics are sessions per user within a given amount of time, the average session length per user and the ratio of daily active users to monthly active users to determine how well you’re turning infrequent relationships with users into frequent, long-term ones,” says Josh Todd, chief marketing officer of analytics firm Localytics.
Examining the length of sessions for different types of users, such as those who go on to make purchases and those who do not, can allow a developer to optimise specific screens to encourage the users to spend more time in the app.
Similarly, the basic retention rate shows whether users are coming back for more or abandoning the app after one or two uses. But examining the drop-off rates for specific screens within an app can, far more valuably, reveal the likely reason behind these patterns.
By observing what actions users are taking on each screen, it’s possible to see which parts of an app’s screens are being ignored and at which points users are liable to abandon the app.
If they are frequently getting stuck or experiencing problems at one particular stage, then something needs to change. By optimising any problematic screens and retesting with users, it’s possible to improve engagement and, ultimately, funnel users down the desired route.
Developer priorities
Developers will have their own priorities when it comes to the metrics they use to define the success of an app, depending on the app’s particular function. A retailer, for instance, is likely to be most interested in the conversion rate for purchases, while a health information service might be more concerned with the number of visitors signing up for further alerts.
When games developer Certain Affinity launched Age of Booty: Tactics, for example, its primary aims were to maximise user retention and make the game as viral as possible. Using Google Analytics, the company looked at average screen time and the flow of user actions, and was able to discover that many users were struggling with the first version’s over-complex menus.
“It enabled us to quickly identify areas of needed improvement which would have otherwise limited our potential success once in the market,” says Patrick Bergman, Certain Affinity’s business development manager.
The way to keep users’ attention is through increasing personalisation, with apps aware of users’ activity across all channels
It’s important to understand that people tend to use mobile apps very differently from web applications, so usability can mean something very different too. According to research from Localytics, mobile users are regularly active across a range of apps, launching them on average 15 times a day and consistently using an average of 18 apps a month.
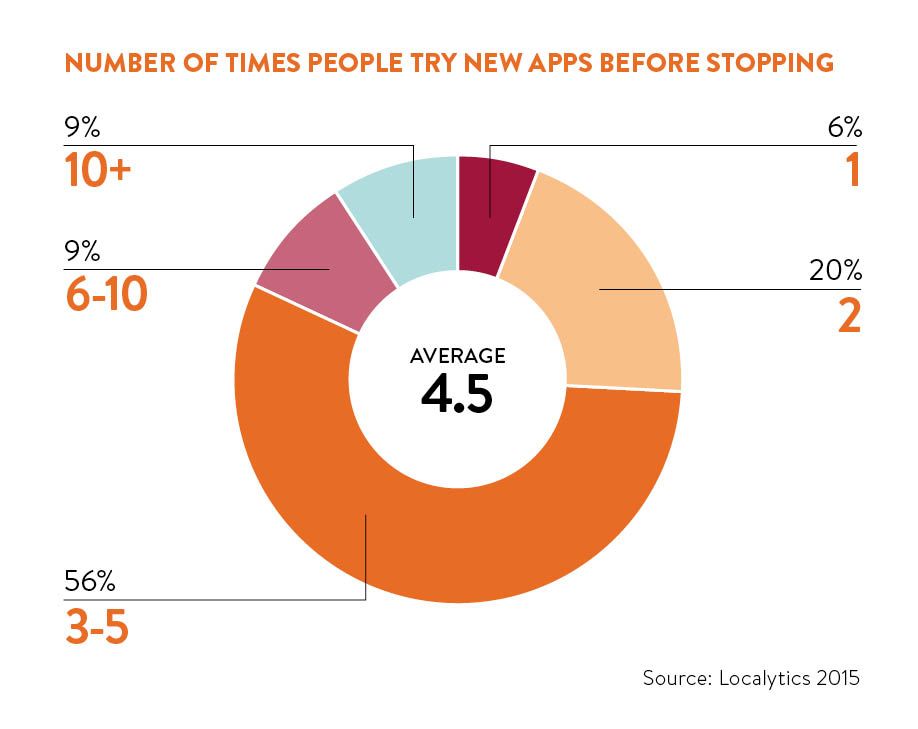
They tend to “snack” on these apps, logging short sessions with several apps in one day, particularly accessing social media apps, weather apps, gaming apps and sports apps this way. And they’re fickle, abandoning apps as soon as they perceive them to have lost value or become boring.
The research revealed that 25 per cent of apps are only used once and 58 per cent will churn in the first 30 days of using an app. Three quarters will leave within the first three months.
The way to keep users’ attention, according to the analysis, is through increasing personalisation, with apps aware of users’ activity across all channels, online and in-store, as well as on the app itself. This, plus regular two-way interaction, creates a long-term relationship that reduces churn.
“User experience encompasses all interactions that someone has with a brand. On mobile, those might be via push notifications or in-app messaging. When thinking about what matters most, it is important to view iterations across a user’s life,” says Mr Todd.
“The most successful apps think about the downstream engagement impact of their efforts, long after a specific interaction occurs. This broader focus addresses the unintended consequences, like user churn, of an interaction and ensures that the app experience is working the way it is intended to.”
CASE STUDY: HUNGRYHOUSE
 For some companies, an app isn’t simply part of the business model – it’s actually what makes the business. Such companies are springing up rapidly, as they can often have very low entry costs.
One example is Hungryhouse, part of Delivery Hero, which allows people to order takeaways from dozens of local restaurants through a single mobile app. Here, usability is more or less the only aspect of the business that matters, making user analytics of paramount importance.
Like so many enterprises, Hungryhouse was concerned about its rate of customer churn, which it defined as customers who had not completed a food order in 30 consecutive days.
By scanning Hungryhouse’s users’ historical data and calculating the churn rate for each group of users that performed each event at various times, Localytics was able to extract a wealth of useful data.
Customers who successfully checked out at least once in their first 14 days with the app were 16 per cent less likely to churn, for example, and those who tapped a restaurant at least three times in their first three days were 13 per cent less likely to churn. The results have helped the company tweak its app
“For some time, we’ve been wondering what key factors lead to churn besides the obvious,” says Delivery Hero marketing executive Erik Kubik. “Being able to see and fully understand these factors lets us plan effective campaigns without leaning on our business intelligence team to crunch numbers.”
Apps for brand recognition
Creating a flawless digital experience
