It is called the Kate Middleton effect. The Duchess of Cambridge, as she is formally known, wears a fancy frock to a charity do. And bang – a chain reaction is set in play. A popular newspaper runs a spread on her outfit. Her adoring public rush to the shop, and buy up every size and colour. The shop’s website groans under the weight of traffic as frantic royalists search for the last remaining bit of stock. And then the poor data scientists at the retailer have to tell the boss why they didn’t see it coming.
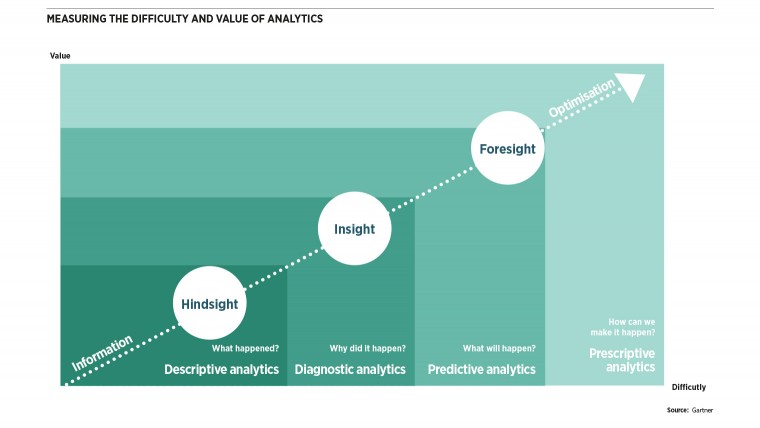
The royal wardrobe stampede is a prime example of when data can’t help you. The existing numbers simply can’t forecast the rush. It is a “black swan” event, a term coined by statistician Nassim Nicholas Taleb for those unseeable, yet huge, events which occur periodically.
In fact, there are numerous situations which market research simply struggles to handle. To be a true master of market research you need to know these limitations.
Chaos theory is part of the equation. Some data sets are inherently volatile. Weather systems, for example. Super-computers can stretch forecasts out to five days, but after that the system is too chaotic to map.
False correlations are a constant headache for data scientists. Nils Mork-Ulnes, head of strategy at Beyond, a digital marketing agency for the likes of Google and Virgin, says: “It’s just as easy to reach spurious correlations as it is to find weird, unexpected behavioural links like Amazon did when its algorithm linked sales of adult nappies to those of Call of Duty.”
The Tylervigen.com website offers dozens of wonderful charts showing odd correlations. For example, the number of people who drown in swimming pools matches perfectly with the number of films Nicholas Cage stars in a year. Spooky? Er, no. The lesson is that unless you know why two things are linked, there will always be a risk that the link is co-incidence. Big data is plagued by this phenomenon. Data scientists often boast they don’t even want to know why a link between two things exists. The prevalence of false correlations means they need a rethink.
Reliable market research needs big data volumes. Errors occur when researchers underestimate how much data they need. Eric Fergusson, director of retail services at data consultancy eCommera, spends a lot of time advising clients on the shortcomings of their data research.
Mr Fergusson says A/B testing – of a hypothesis with two variants – is a bugbear. “We are all excited by A/B testing comparing e-mails or homepages. It’s great,” he says. “We are using data not hunches. But A/B testing requires large samples to get robust insights. E-commerce is affected by all sorts of things, such as stock promotion, availability and other things. Or you might have quite distinct groups of customers visiting.”
He warns that even a £10-million revenue business can get tripped up by flawed A/B testing: “If you are selling £500 orders then that isn’t very many visitors, so building up sufficient numbers can take weeks. During that time other things will distort your tests.”
There is a fabulous solution. “We ask clients to run A/A tests [where two variables are, in fact, exactly the same] to see at what point the results become standard. It gives you a view of the requisite sample size,” says Mr Fergusson.
Put simply, you run two identical campaigns – mailshots or homepages – and wait until the data in both samples becomes equal via the law of averages. Then you know how many visitors it takes to iron out all the anomalies. “Not many people do it, as they have a backlog of 20 ideas to test and new software to play with, so the research team doesn’t want to tell the chief executive they are testing the sample size – not exciting enough,” he says.
Another big danger is that the data is missing vital information. In the multi-channel shopping environment, in which consumers can buy online, in store, via mobile or using a catalogue and telephone service, retailers struggle to build a complete picture of their consumers.
Mr Fergusson is acutely aware of the damage this does: “If you retarget a consumer who has browsed on your website, how do you know whether they’ve gone into the store and bought the product there?” The solution is more data. “We are going to be seeing a lot more innovation around loyalty cards,” he says. When loyalty cards work across all forms of shopping, or there is true omnichannel consumer tracking via debit and credit cards, then retailers will get a complete picture. Until then retailers lack a full picture of customer behaviour.
There’s an old joke about an economist on his hands and knees under a street light looking for his keys. A police officer asks, “Where did you drop them?” The economist answers, “Down that dark alley, but the light is better here.” Data scientists are often guilty of the same crime. They use the data they have to tell them what they want to know, instead of searching for truth impartially.
Chris Barrett, director at data analytics firm Concentra, says: “Unfortunately, we are highly susceptible to selection bias and will seek out trends which support our theories. Models are validated against historical data, often the same source data against which the model was developed, and the more data that is available, the greater the probability that a correlation can be found which supports a favoured theory. It is easy to build a model which perfectly predicts the past and thus reinforce the mistaken belief that correlation implies causation.”
Not only is it important to quantify errors in prediction, it is also important to understand the nature of the error
Data can be unreliable. Hannah Campbell, operations director at sampling and research agency The Work Perk, says: “Consumers don’t always act the way they say they will, so although quantitative research is essential for making marketing predictions, based on behavioural analysis, growth trends, sales history and so on, it can lack depth if it is not paired with qualitative data.”
Data may fail to tell you what you want to know. Ms Campbell warns: “Data can provide an in-depth picture of sales for a toothpaste brand, but it doesn’t indicate whether or not consumers are buying into the brand’s philosophy, their opinion on the price point or their motivations for purchasing that particular product.”
Ultimately, there will be some issues which are non-numeric by nature. Should you buy a Labrador puppy? Is eating whale meat morally justifiable? Is assisted dying a human right? Numbers skirt around the issue. They will never resolve these questions.
In order to do solid market research, it is important to understand all these limitations.
Ted Dunning, chief application architect at MapR Technologies, concludes: “Not only is it important to quantify errors in prediction, it is also important to understand the nature of the error. For instance, we might be certain that it will rain two days from now, but be uncertain of just when. That could look like 100 per cent uncertainty in whether it will rain at any particular time, but just saying that leaves out much of what we do know.
“Realistically estimating what we do not know greatly increases the practical value of what we do know.”


