It is said the British love to queue. However, that tolerant attitude to standing in line does not extend to sitting in traffic – everybody hates a jam. For city planners, dwellers and commuters the world over, congestion is the enemy.
According to the INRIX 2015 Traffic Scorecard, while the United States had the worst congestion on average, it was a UK city that topped the world list for metropolitan areas. In London last year, it was estimated that drivers wasted an average of 101 hours, or more than four days, in gridlock. This figure marked the first time a metro area had surpassed the 100-hours threshold, making the capital a record-breaker of the wrong kind.
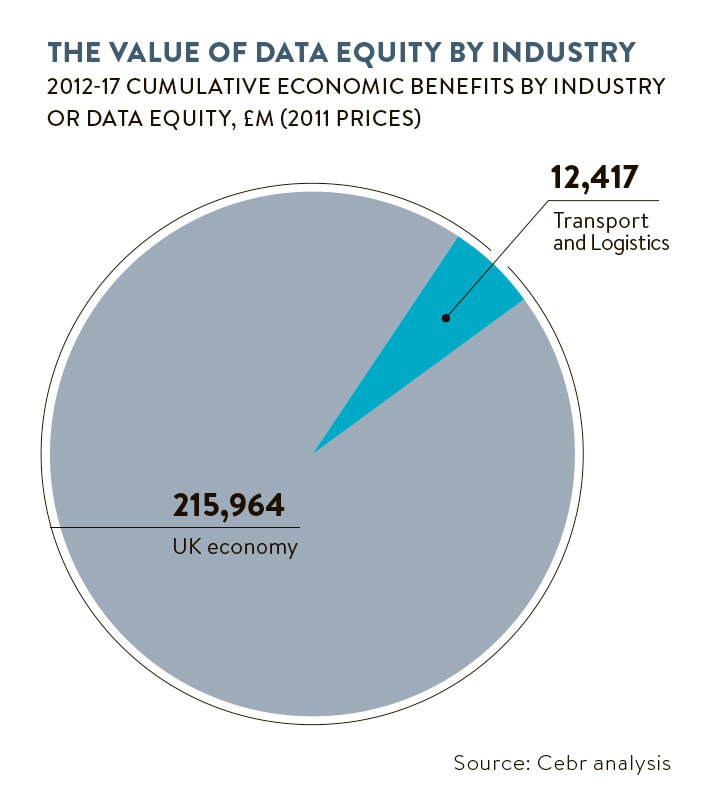
Congestion is bad for business. An earlier INRIX study conducted in 2014 with the Centre for Economics and Business Research forecast the cost to the UK economy would be a staggering £307 billion between 2013 and 2030.
And congestion is also harmful to urban resilience, impacting negatively on both environmental and social sustainability, in terms of emissions and global warming, plus air quality and public health. As for the liveability of a modern city, congestion is effectively part of the urban transport user experience (UX).
Calculating levels of UX satisfaction at any given time means solving a complex equation with a range of key variables and factors: total number of transport assets (such as road and rail capacity, plus parking spaces), users (vehicles, pedestrians), incidents (roadworks, accidents, floods and breakdowns), plus expectations (anticipated journey times and passenger comfort). To do the maths requires one essential – data.
Data for smart transport
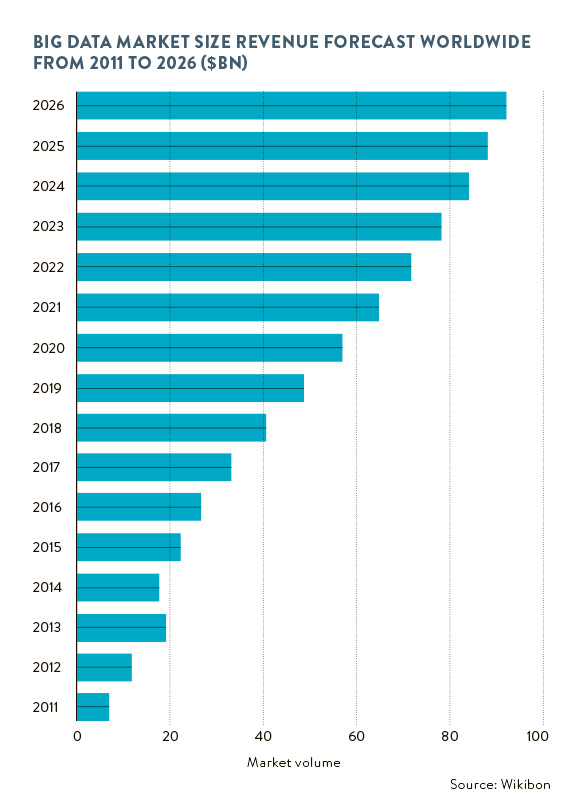
Driven by one trillion sensors becoming active throughout our environment by 2025, it is boom time for big data and the internet of things. Figures from Gartner estimate 6.4 billion connected things now in use worldwide, up 30 per cent on last year and rising at a remarkable rate of 5.5 million new additions a day. Total things will hit 20.8 billion by 2020, of which a quarter of a billion will be connected vehicles.
This growing availability of data sources within our cities means analytics offer potential to open up a whole new era of smart transport, explains Hussein Dia, associate professor at Swinburne University of Technology, Melbourne, Australia.
“The fusion of urban data from increasingly complex networks of sensors allows for new ways to ‘sense the city’ and enhance transport capability and resilience. Predictive analytics provide a unified approach for extracting useful urban mobility information from networked infrastructure, connected vehicles and smartphones, for real-time estimation of traffic patterns, and deployment of management strategies,” Dr Dia says.

However, it is only early days. He adds: “While decision-makers and city leaders are recognising the role of data analytics in ‘sweating of assets’ and providing innovative solutions to meet demand, deployment at a global scale is still in its infancy.”
Dr Dia’s cautious optimism is echoed by Mark Wedlock, associate director of smart mobility and intelligent transport systems at Arup. “Predictive analytics on its own is not the solution to rising congestion,” he says. “However, what it does enable is a transition from reactive to proactive traffic management regimes.
“As the amount of data about current and future travel demands increases in the connected world, so the possibility of better analytics increases. In order to have real benefit, though, predictive analytics for transport as a whole is required.”
The emerging science of predictive analytics has already seen numerous successful urban transport applications
Alongside need for scale and a more systemic application that would support better modal shift, requirement for real-time inputs is also critical, says Tim Barber, vice president for software solutions, Europe, the Middle East and Africa, at global technology company Pitney Bowes.
“Collecting reams of data isn’t enough. You have to be able to validate, link and access data in real time to extract meaningful, accurate insight, and predict trends and patterns. Data decays at 2 per cent per month, so the real-time element is crucial,” he says.
[embed_related]
Predictive analytics
Caveats aside, the emerging science of predictive analytics has already seen numerous successful urban transport applications.
In the US, use of the world’s largest community-based traffic and navigation app Google Waze helped tackle the scourge of double parking in Boston, Massachusetts. Whereas, in the Irish Republic, IBM has been using big data with the City of Dublin to identify and solve root causes of traffic congestion in its public bus network.
Using an array of sources – timetables, inductive-loop traffic detectors, rain gauges and CCTV cameras, plus GPS updates every 20 seconds for each of the city’s 1,000 buses – a digital map of Dublin gets overlaid with real-time positions of services using stream computing and geospatial data.
Focusing on benefits to intelligent systems and networks, it is easy to lose sight, however, of the urban UX. Here, for example, predictive analytics can be vital in facilitating emergency response, both for general road users and key services.
As project director at Mott MacDonald, Martin Perks, explains: “Data analytics has a great role to play in helping professionals inform drivers interactively and reduce the risk of accidents, plus support management of incidents when they do occur. Opportunities are far greater for the traffic management community than the individual motorist at the moment, but the community is working hard to improve journey-time reliability.”
This opening-up of the data to the private user, with widescale interoperability, is the real direction of travel. Mr Perks concludes: “Accessibility to the individual of analysed metadata against the backdrop of live traffic information is where the future is headed.”
CASE STUDY: CITY OF MORENO VALLEY
As one of California’s fastest emerging cities, Moreno Valley has witnessed spectacular population growth since incorporation in 1984, with total numbers up four-fold to more than 200,000.
Given that its rise over the last three decades has spanned two global recessions, the growth spurt has not been without its challenges. As a result, the City of Moreno Valley found itself keen to address a basket of civic and development issues to make the most of in-house capabilities coming under significant budget pressure.
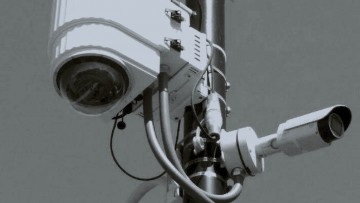
Prime mover behind the quest for innovative solutions was the Moreno Valley Police Department, desperate for technological support to back up and boost its shrinking staff numbers. With public safety therefore a priority, it made sense to pursue a community-wide camera system and video platform, but with additional data blend and analytics capabilities, plus strong interoperability to enable partnering.
The municipality adopted Hitachi Visualisation, working with public and private entities to build an effective and accessible video and data ecosystem, combining edge-capture devices and cloud-based software.
Devices include high-definition video cameras with analytics, plus intelligent gateways for external sensor data, third-party video integration and live streaming. The unique software is ideal for capitalising on rapid response and actionable data intelligence in the event of emergency or crisis.
The resulting integrated video and data resources are displayed, along with any real-time alerts and live feeds, on an intuitive, map-based screen. A software-as-a-service or SaaS model also enables turn-key deployment and easy integration.
A ten-month implementation period saw 212 cameras mounted initially throughout the city, rising to 275 active now. With real-time monitoring, signal-timing adjustment and priority-routing capabilities, the benefits to transportation management have proved significant, says city traffic engineer Eric Lewis.
“From special events, such as the air show and July 4 parade, to what’s happening in construction work zones, we are moving traffic in the ways it demands. We have central-control software for both traffic management and emergency vehicle pre-emption. Now we can see exactly what’s happening, what resources to deploy and make any changes on the fly,” he says.
Data for smart transport


